

Basic Data
Overall Function Description
Through the dimension-specific statistical chart pages in the Basic Data Module, you can quickly and comprehensively understand the historical and real-time status of bandwidth, traffic, request count, status codes, hit rate, and other metrics of the CDN service during operation. Based on comprehensive data statistics, you can analyze the business status and use it as a basis for decision-making.
On the three pages of Bandwidth, Traffic, and Request Count, you can view statistical data for two categories: Access Data and Origin-pull Data.
Bandwidth
Page Overview
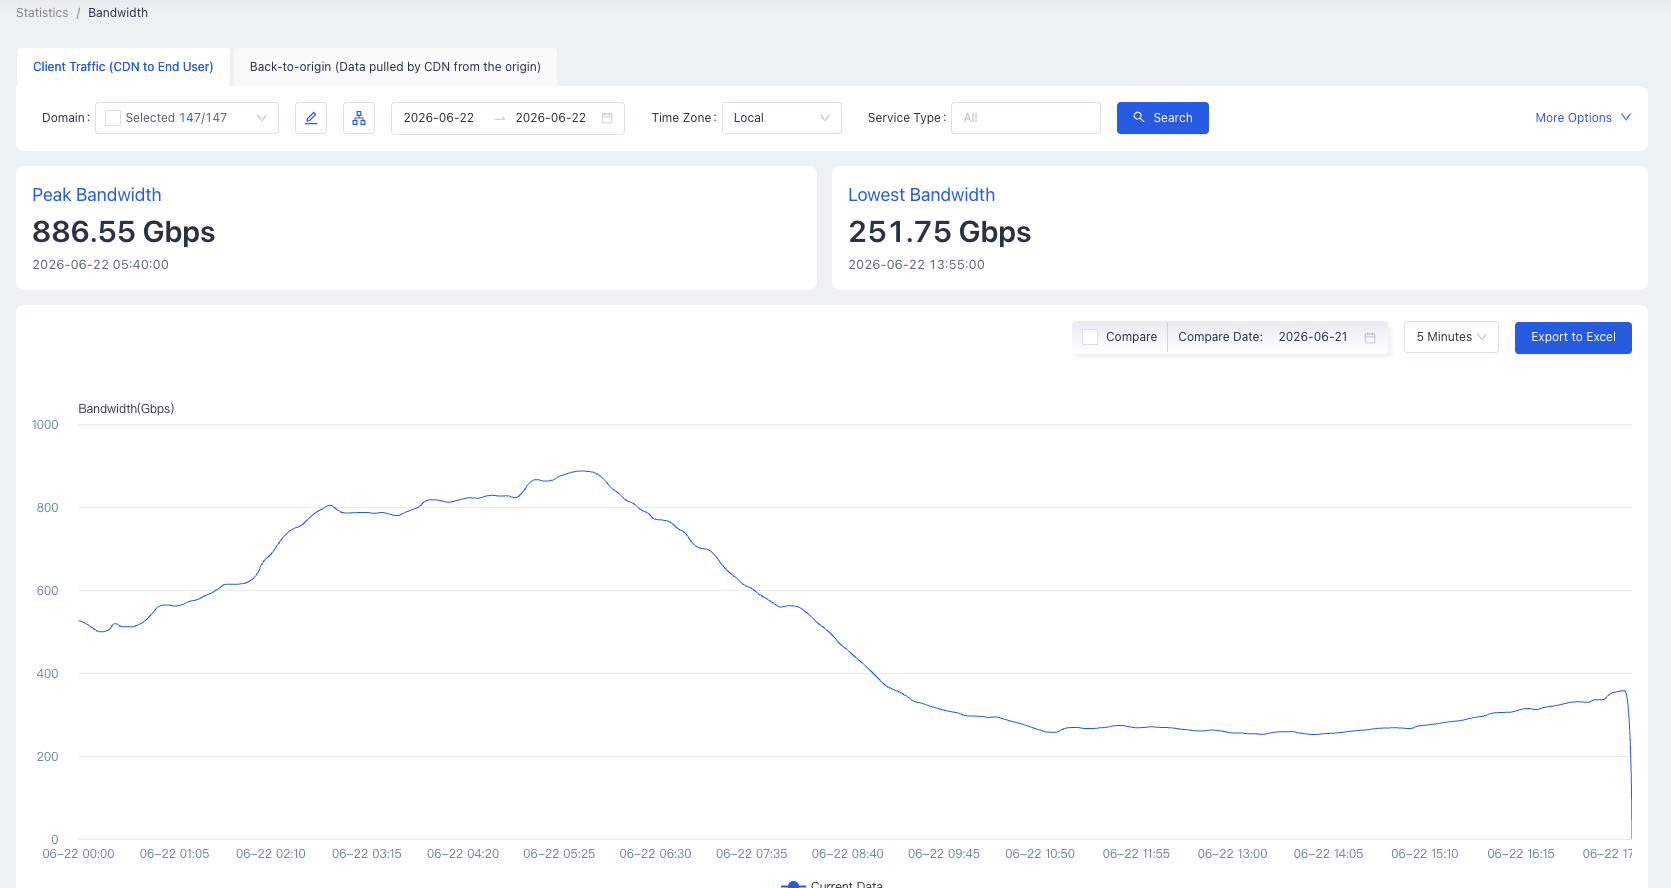
On the [Statistics]- [Bandwidth] page, you can view the bandwidth usage corresponding to Access Data and Origin-pull Data of the CDN service. The bandwidth counted in this function refers to the traffic value per unit time (per second), with each minute as a monitoring and statistical cycle for numerical values, accurate to bps as the minimum unit.
Supported filter dimensions include: Date Range, Service Type, Accelerated Domain, Application Layer Protocol Type (HTTP and HTTPS), and IP Protocol Type (IPv4 and IPv6).
Bandwidth Peak/Valley Value
Through this module on the page, you can intuitively view the maximum actual bandwidth usage and the corresponding time point, as well as the minimum bandwidth value and the corresponding time point of the selected accelerated domain within the selected time range.
Bandwidth Usage Trend Chart
The Bandwidth Usage Trend Chart allows you to clearly see the variation trend of bandwidth usage of the corresponding domain over a period of time, as well as the specific value at each moment.
The time range of the trend chart is consistent with the time range configured at the top of the page. Meanwhile, you can export the data in the trend chart as an Excel spreadsheet for archiving or sharing.
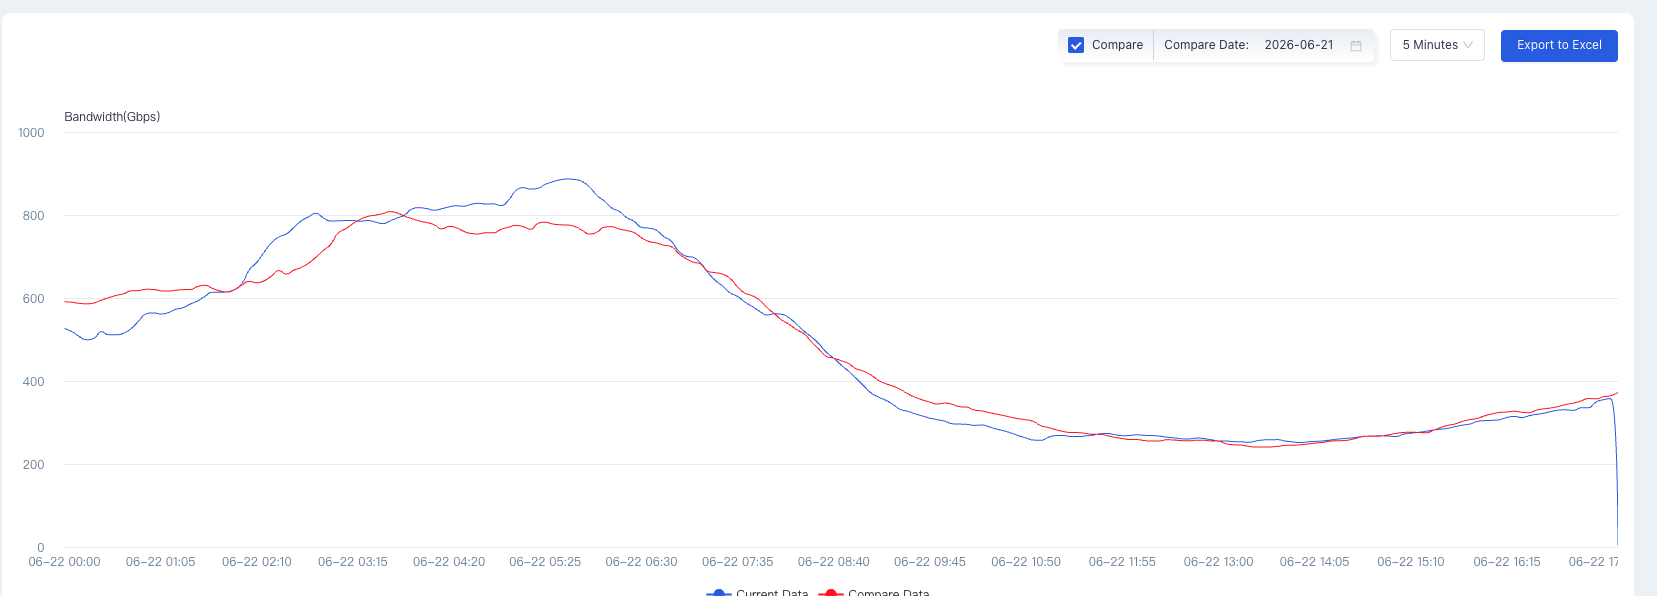
You can use the "Comparison Date" selection box in the upper right corner to select another set of data with the same time span for the bandwidth data of the selected time range. Simply select the start date of the comparison data, and the system will automatically display the data from the selected start date to the same time span as the time range selected at the top of the page for horizontal comparison.
For example, if the time range selected at the top of the page is from October 1, 2021, to October 30, 2021, and the comparison date is set to September 1, 2021, the trend chart will simultaneously display the data from October 1, 2021, to October 5, 2021, and the data from September 1, 2021, to September 5, 2021.
Traffic
Page Overview
On the [Traffic] page, you can view the traffic usage corresponding to Access Data and Origin-pull Data of the CDN service.
Supported filter dimensions include: Date Range, Service Type, Accelerated Domain, Application Layer Protocol Type (HTTP and HTTPS), and IP Protocol Type (IPv4 and IPv6).
Traffic Total Volume/Peak/Valley Value
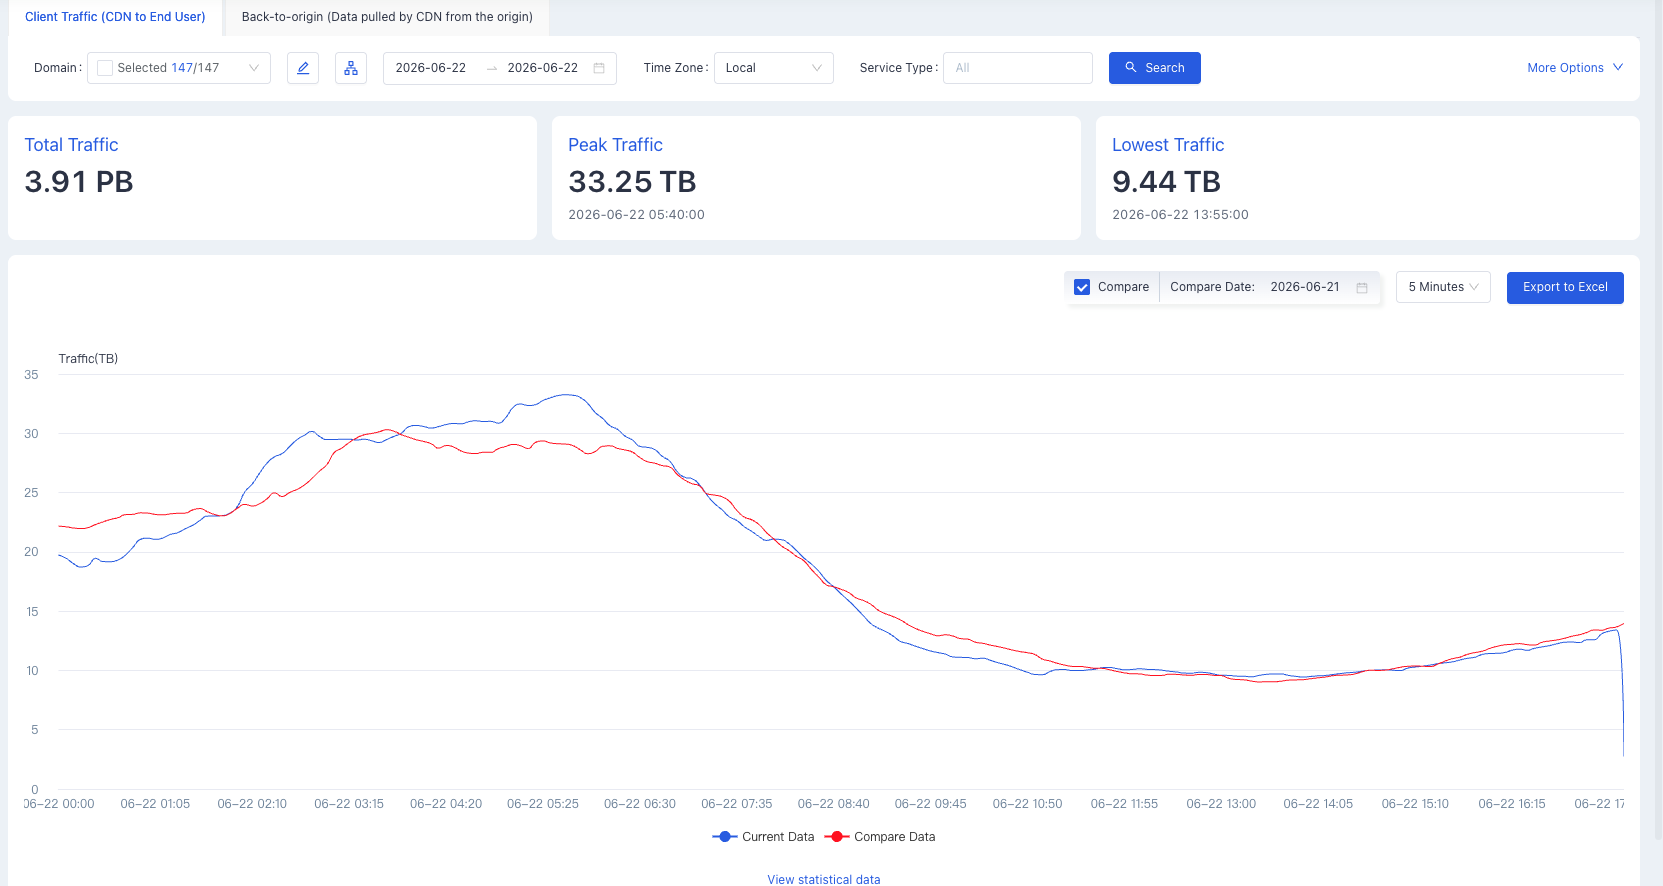
Through this module on the page, you can intuitively view the total traffic usage of Access Data and Origin-pull Data of the selected accelerated domain within the selected time range, as well as the maximum and minimum traffic values among all statistical moments when traffic actually occurs (recorded once per minute).
Traffic Usage Trend Chart
The Traffic Usage Trend Chart allows you to clearly see the variation trend of traffic usage of Access Data and Origin-pull Data of the corresponding domain over a period of time, as well as the specific value at each moment.
The time range of the trend chart is consistent with the time range configured at the top of the page. Meanwhile, you can export the data in the trend chart as an Excel spreadsheet for archiving or sharing.
You can use the "Comparison Date" selection box in the upper right corner to select another set of data with the same time span for the traffic data of the selected time range. Simply select the start date of the comparison data, and the system will automatically display the data from the selected start date to the same time span as the time range selected at the top of the page for horizontal comparison.
For example, if the time range selected at the top of the page is from October 1, 2021, to October 30, 2021, and the comparison date is set to September 1, 2021, the trend chart will simultaneously display the data from October 1, 2021, to October 5, 2021, and the data from September 1, 2021, to September 5, 2021.
Request Count
Page Overview
On the [Request Count] page, you can view the number of end-user requests responded to by Access Data and Origin-pull Data of the CDN service.
Supported filter dimensions include: Date Range, Service Type, Accelerated Domain, Application Layer Protocol Type (HTTP and HTTPS), and IP Protocol Type (IPv4 and IPv6).
Request Count Total Volume/Peak/Valley Value
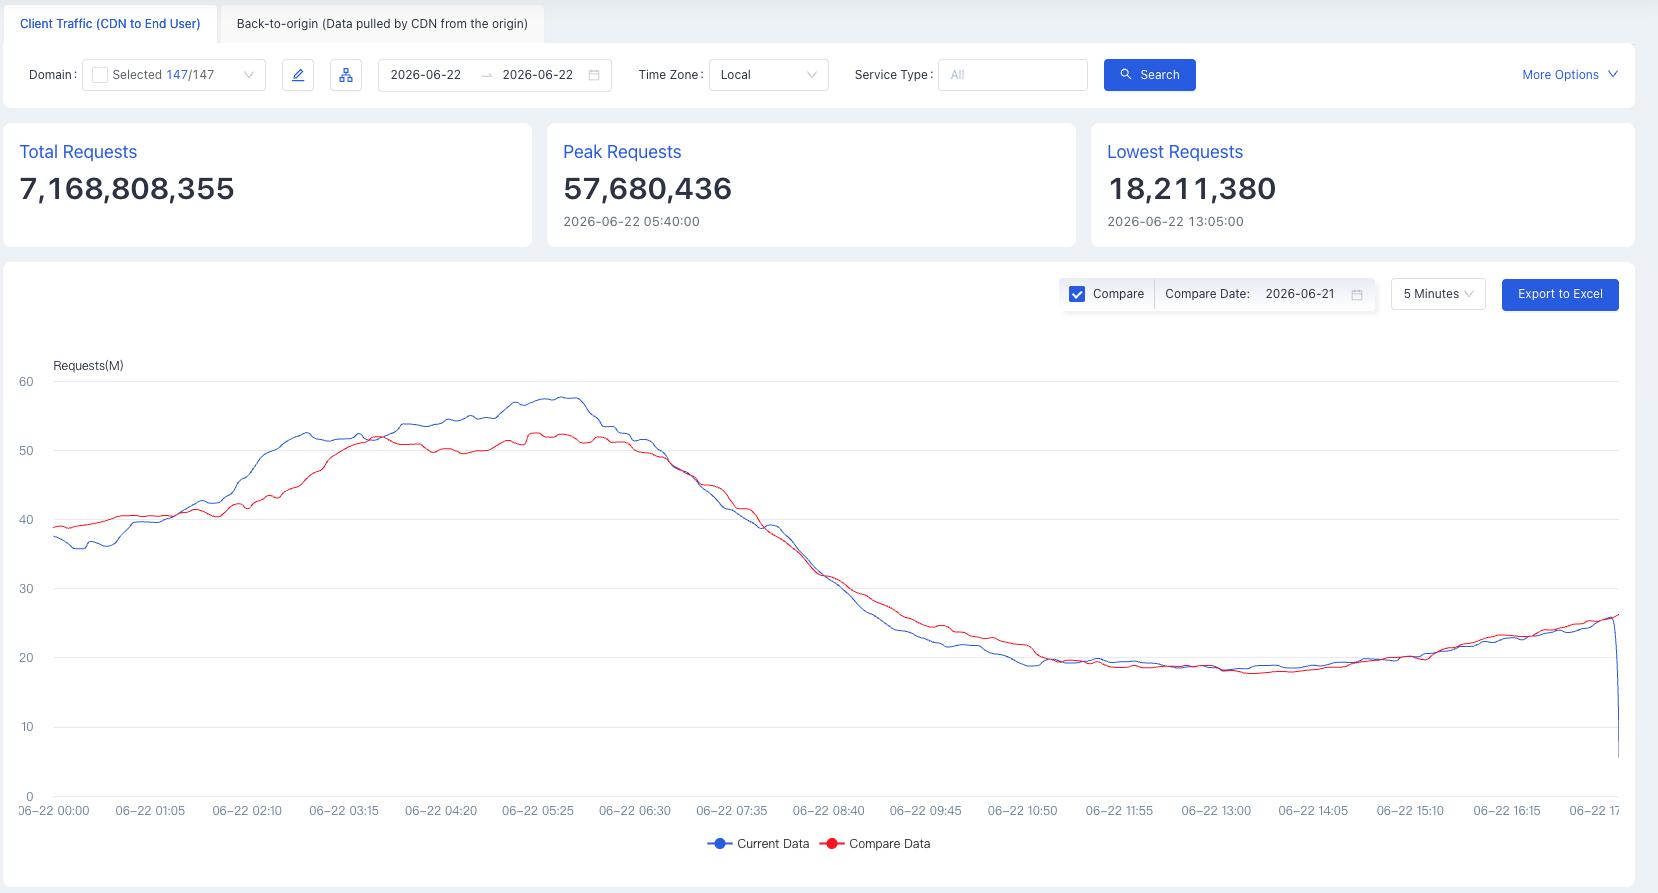
Through this module on the page, you can intuitively view the total number of requests processed by Access Data and Origin-pull Data of the selected accelerated domain within the selected time range, as well as the maximum and minimum number of requests among all statistical moments when requests actually occur (recorded once per minute).
Request Count Trend Chart
The Request Count Trend Chart allows you to clearly see the variation trend of the number of requests corresponding to Access Data and Origin-pull Data of the corresponding domain over a period of time, as well as the specific value at each moment.
The time range of the trend chart is consistent with the time range configured at the top of the page. Meanwhile, you can export the data in the trend chart as an Excel spreadsheet for archiving or sharing.
You can use the "Comparison Date" selection box in the upper right corner to select another set of data with the same time span for the request count of the selected time range. Simply select the start date of the comparison data, and the system will automatically display the data from the selected start date to the same time span as the time range selected at the top of the page for horizontal comparison.
For example, if the time range selected at the top of the page is from October 1, 2021, to October 30, 2021, and the comparison date is set to September 1, 2021, the trend chart will simultaneously display the data from October 1, 2021, to October 5, 2021, and the data from September 1, 2021, to September 5, 2021.
Status Code
Page Overview
On the [HTTP Code] page, you can view the status codes returned in response to all requests of the CDN service. It helps you judge the business operation status and end-user usage based on the quantity and proportion of various types of status codes.
Currently supported filter conditions for querying status codes include: Date Range, Service Type, and Accelerated Domain.
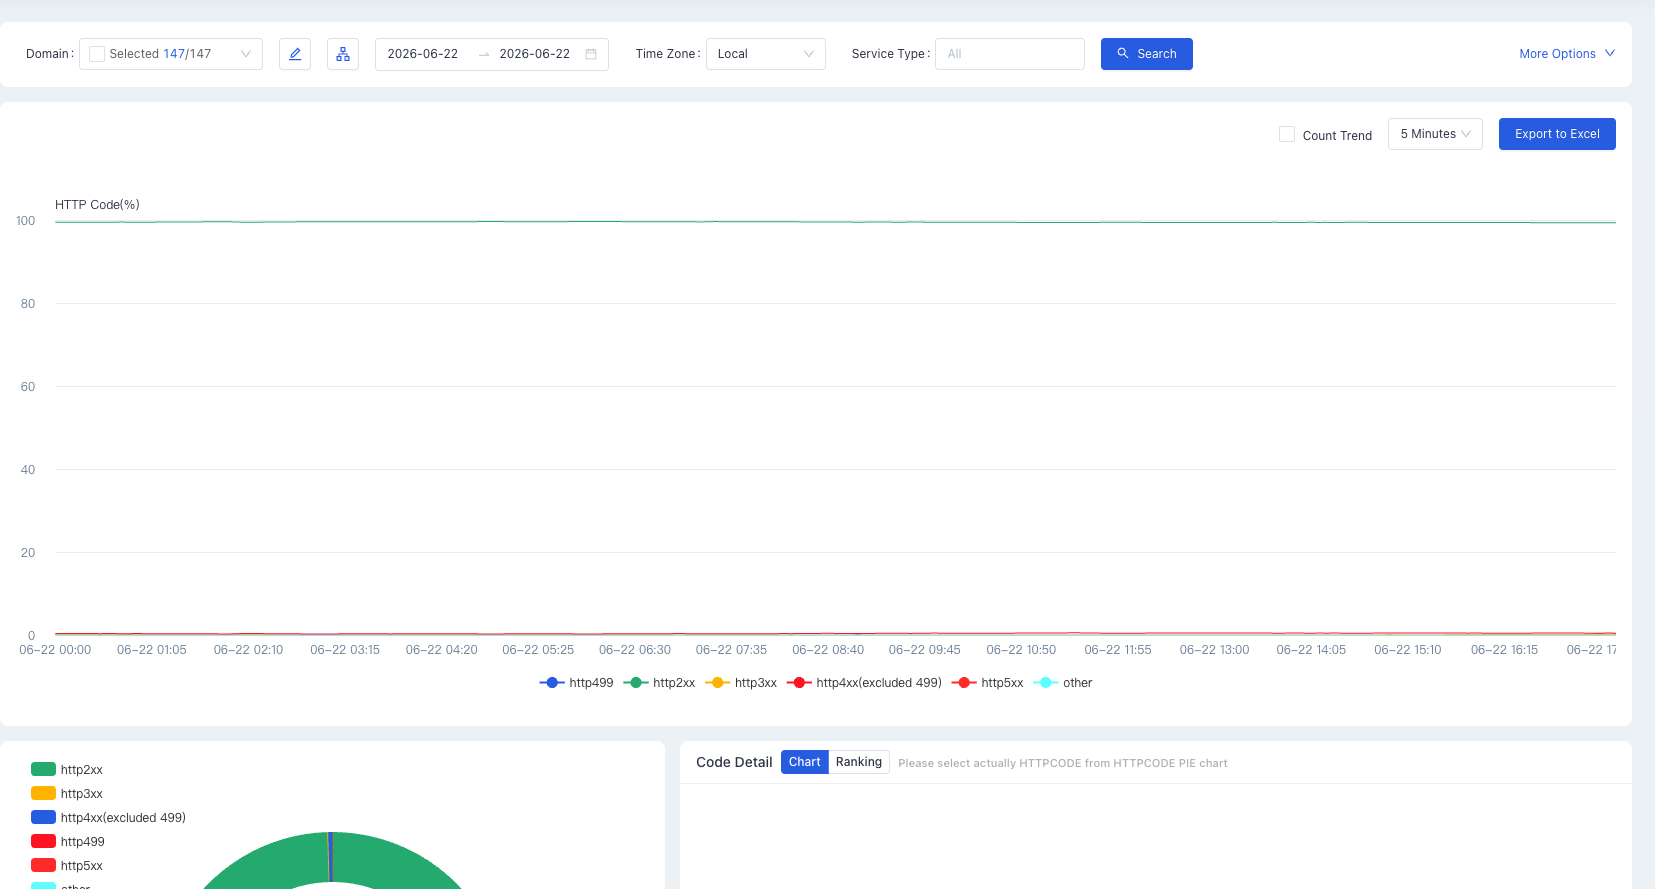
Through this line chart, you can intuitively view the percentage change of each status code among all status codes within the selected time period, thereby judging the change in service response status.
You can not only query data by time range, Service Type, and accelerated domain but also export the queried data as an Excel file.
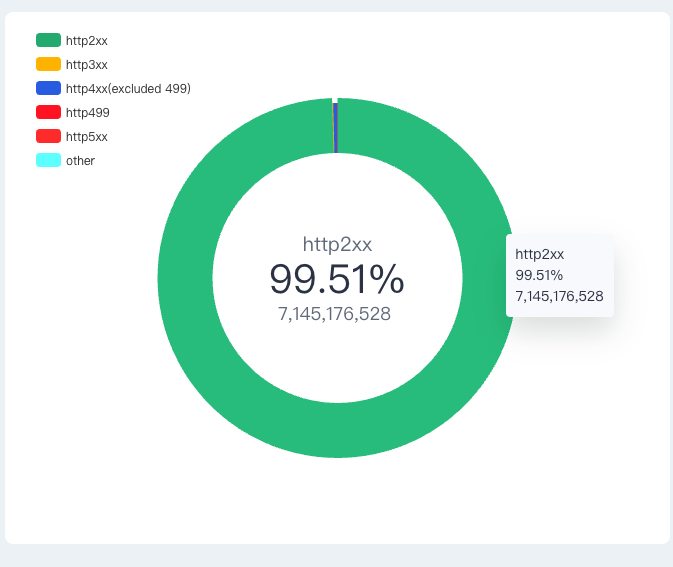
Through this donut chart, you can view the proportion of the number of status codes corresponding to all requests that occurred within the selected time period.
Status Code Details
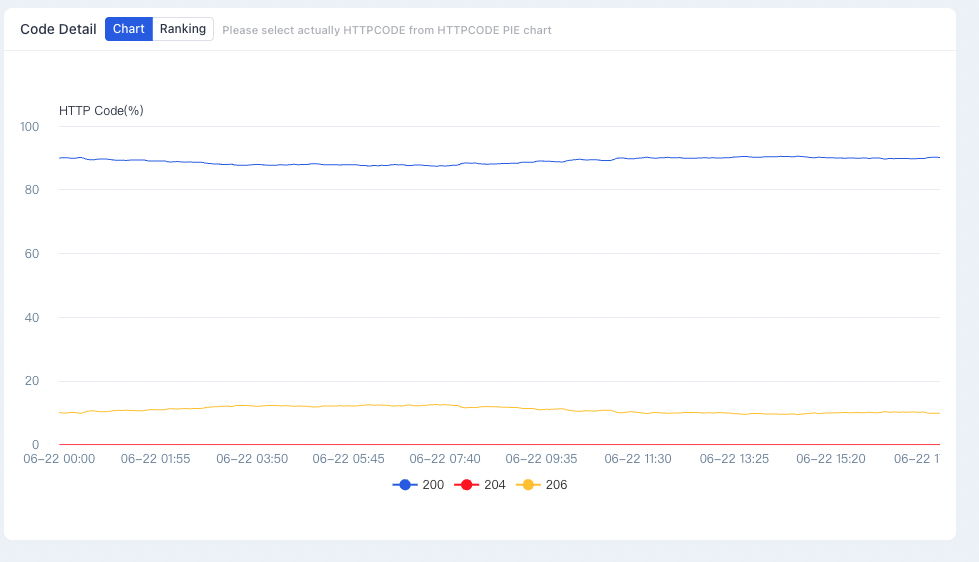
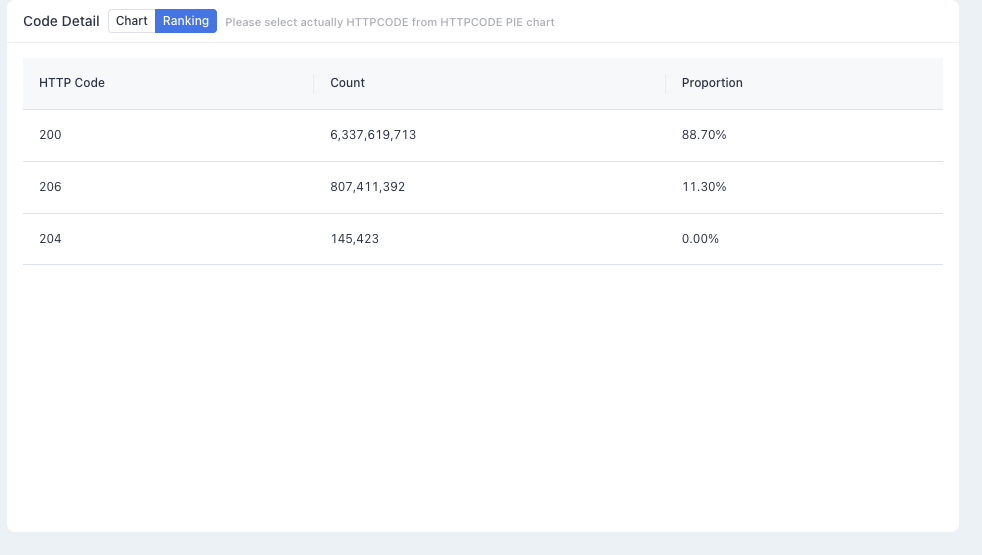
By selecting a specific major status code category (2XX, 3XX, 4XX, 5XX) in the donut chart on the left side of the page (as shown in the above figure), you can view the real-time change of that type of status code and the proportion ranking of sub-status codes.
Hit Rate
Page Overview
On the [Hit Rate] page, you can view the proportion of requests for which resources are returned directly from edge nodes without pulling from parent nodes or origin servers among all requests of the CDN service.
Currently supported filter conditions for querying hit rate include: Date Range, Service Type, Accelerated Domain, Application Layer Protocol Type (HTTP and HTTPS), and IP Protocol Type (IPv4 and IPv6).
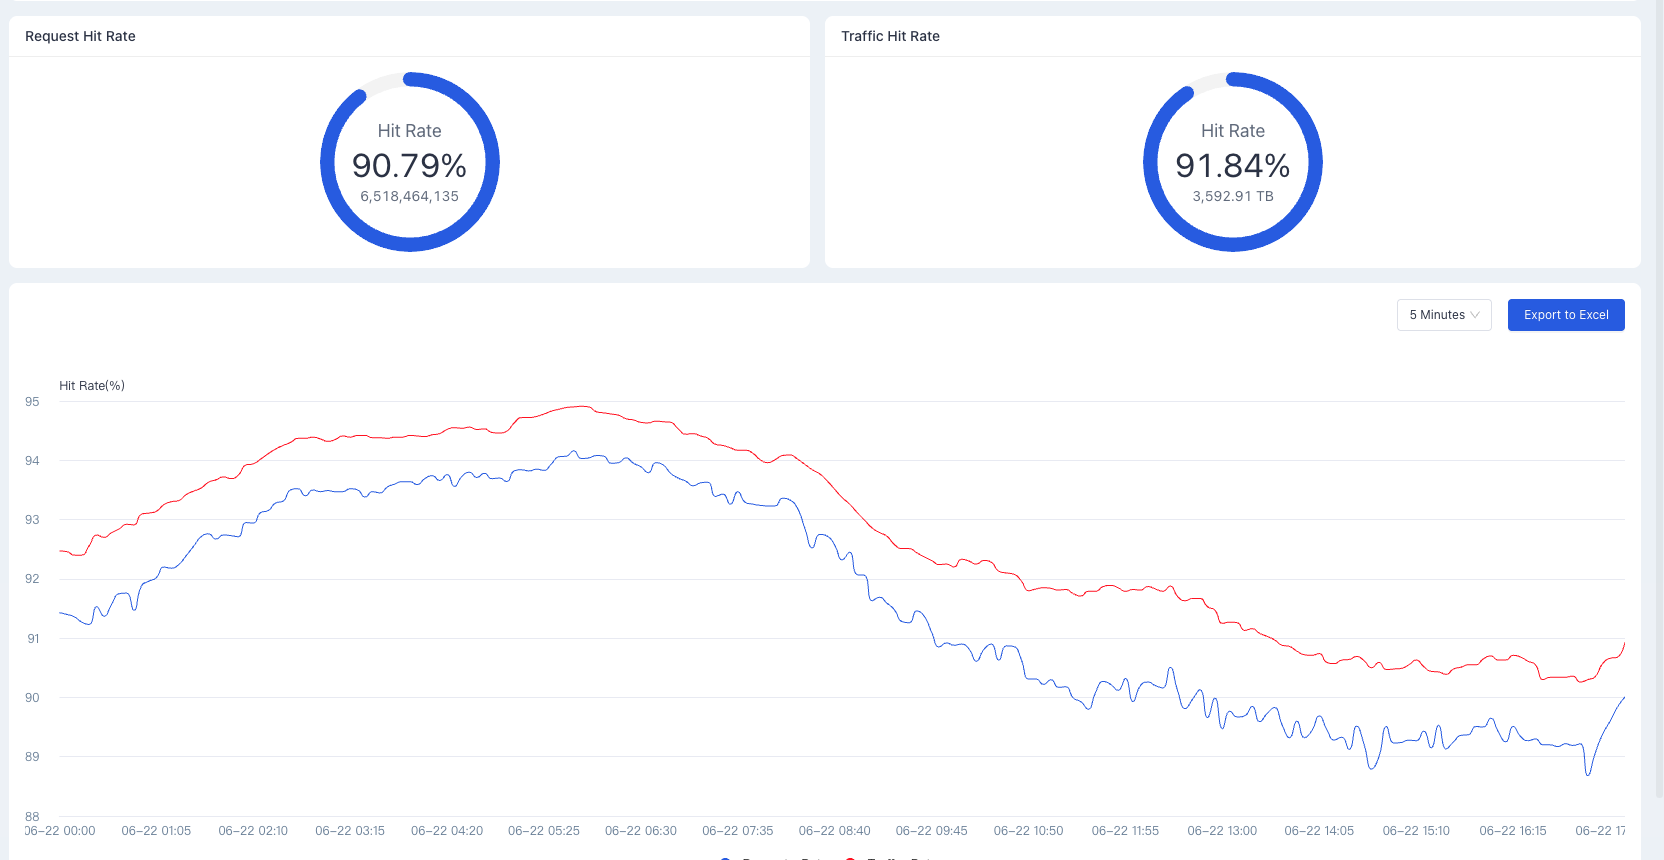
In this module, you can directly see the proportion of hit requests to the total requests (i.e., Request Hit Rate) and the proportion of traffic from hit parts to the total request traffic (i.e., Traffic Hit Rate) under the self-set filter conditions. The larger these two data values are, the more scientific the CDN caching algorithm is, and the greater the value of CDN usage.
In this module, you can observe the variation trend of Request Hit Rate and Traffic Hit Rate over the self-queried period of time. Meanwhile, you can also export the queried data as an Excel file as needed.
Need help? Contact our support team at support@edgenext.com.
Back to documentation home